Sign In
Create your first automation in just a few minutes.Try Studio Web →
Toucan Toco - RPA Data Stories
by YouTube
0
Tool
<100
Summary
Summary
Interactive data visualization application, for intuitively monitoring your RPA digital workforce
Overview
Overview
- Toucan Toco data visualization apps allow both real-time monitoring of your digital workforce and getting business insights out the data processed by the robots
- Toucan Toco offers a smooth, intuitive and user friendly interface. It assures an easy grasp of the data through navigation and storytelling-based experience
- Toucan Toco apps run flawlessly across any type of device (desktop, tablet, mobile, data wall, embed) which allows an easy and instant access to your data stories
- Toucan Toco offers both SaaS and OnPrem deployments
- Toucan Toco can be used both by business users who want to focus on a set of specific RPA processes in detail, and C-level managers who need an overview of digital workforce KPIs or a synthesis of the outcomes
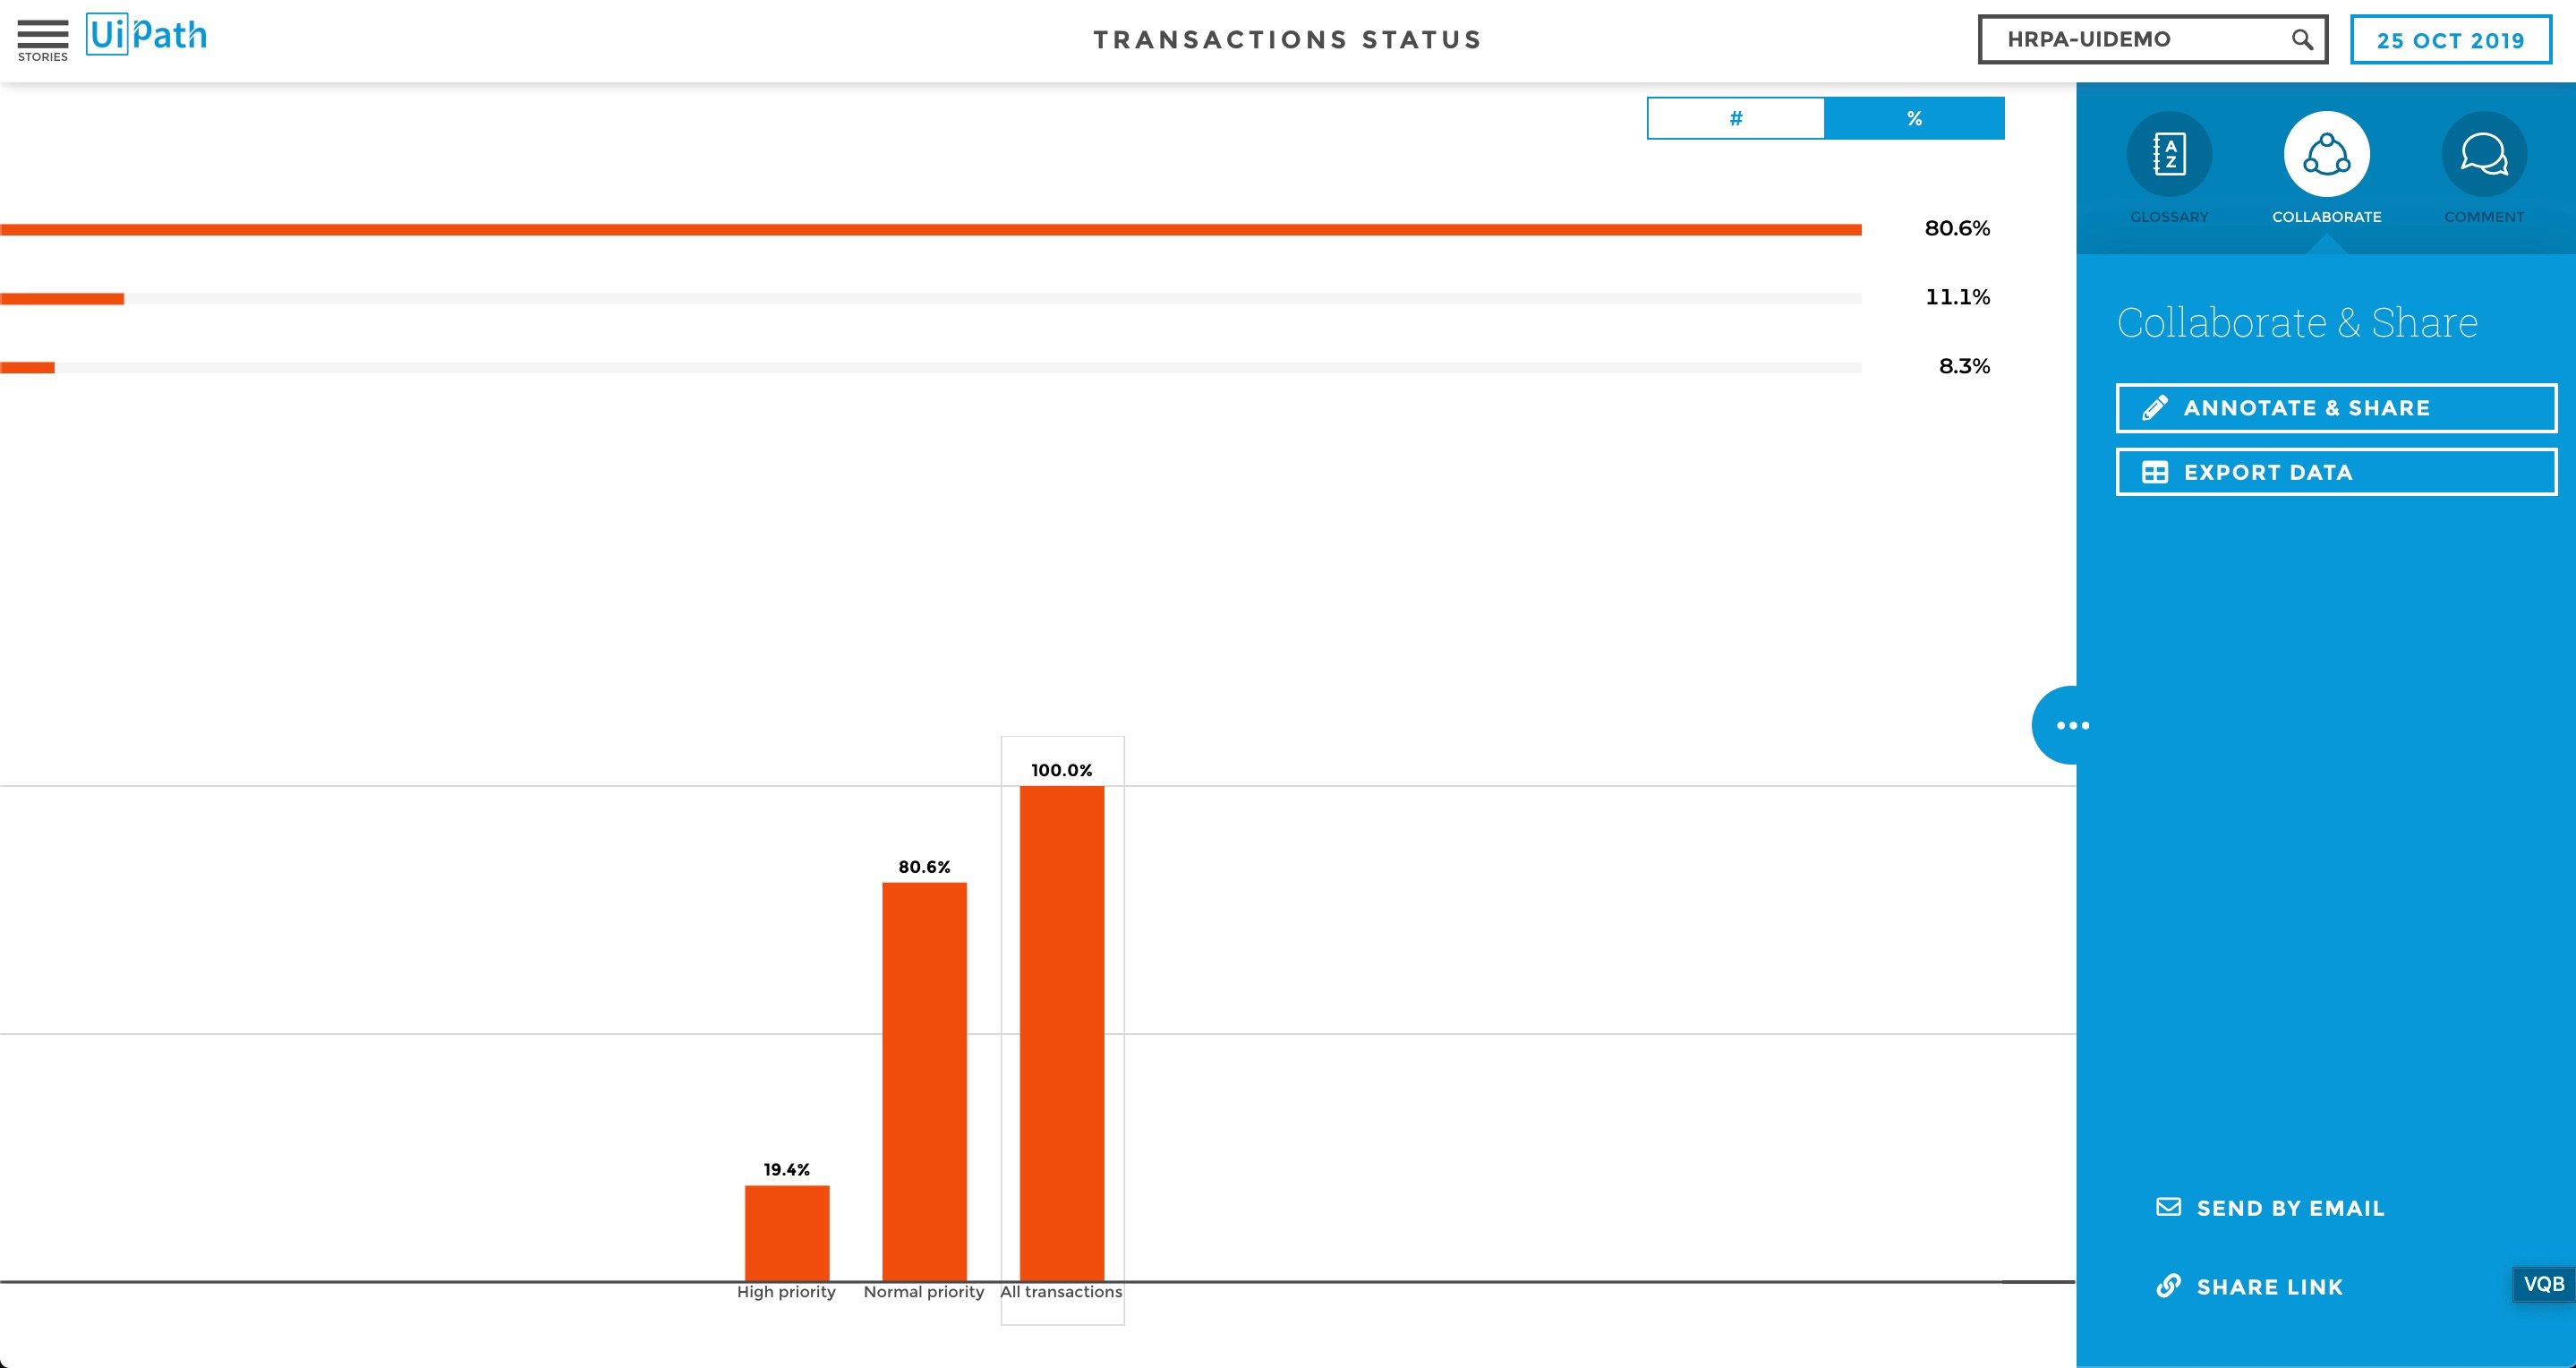
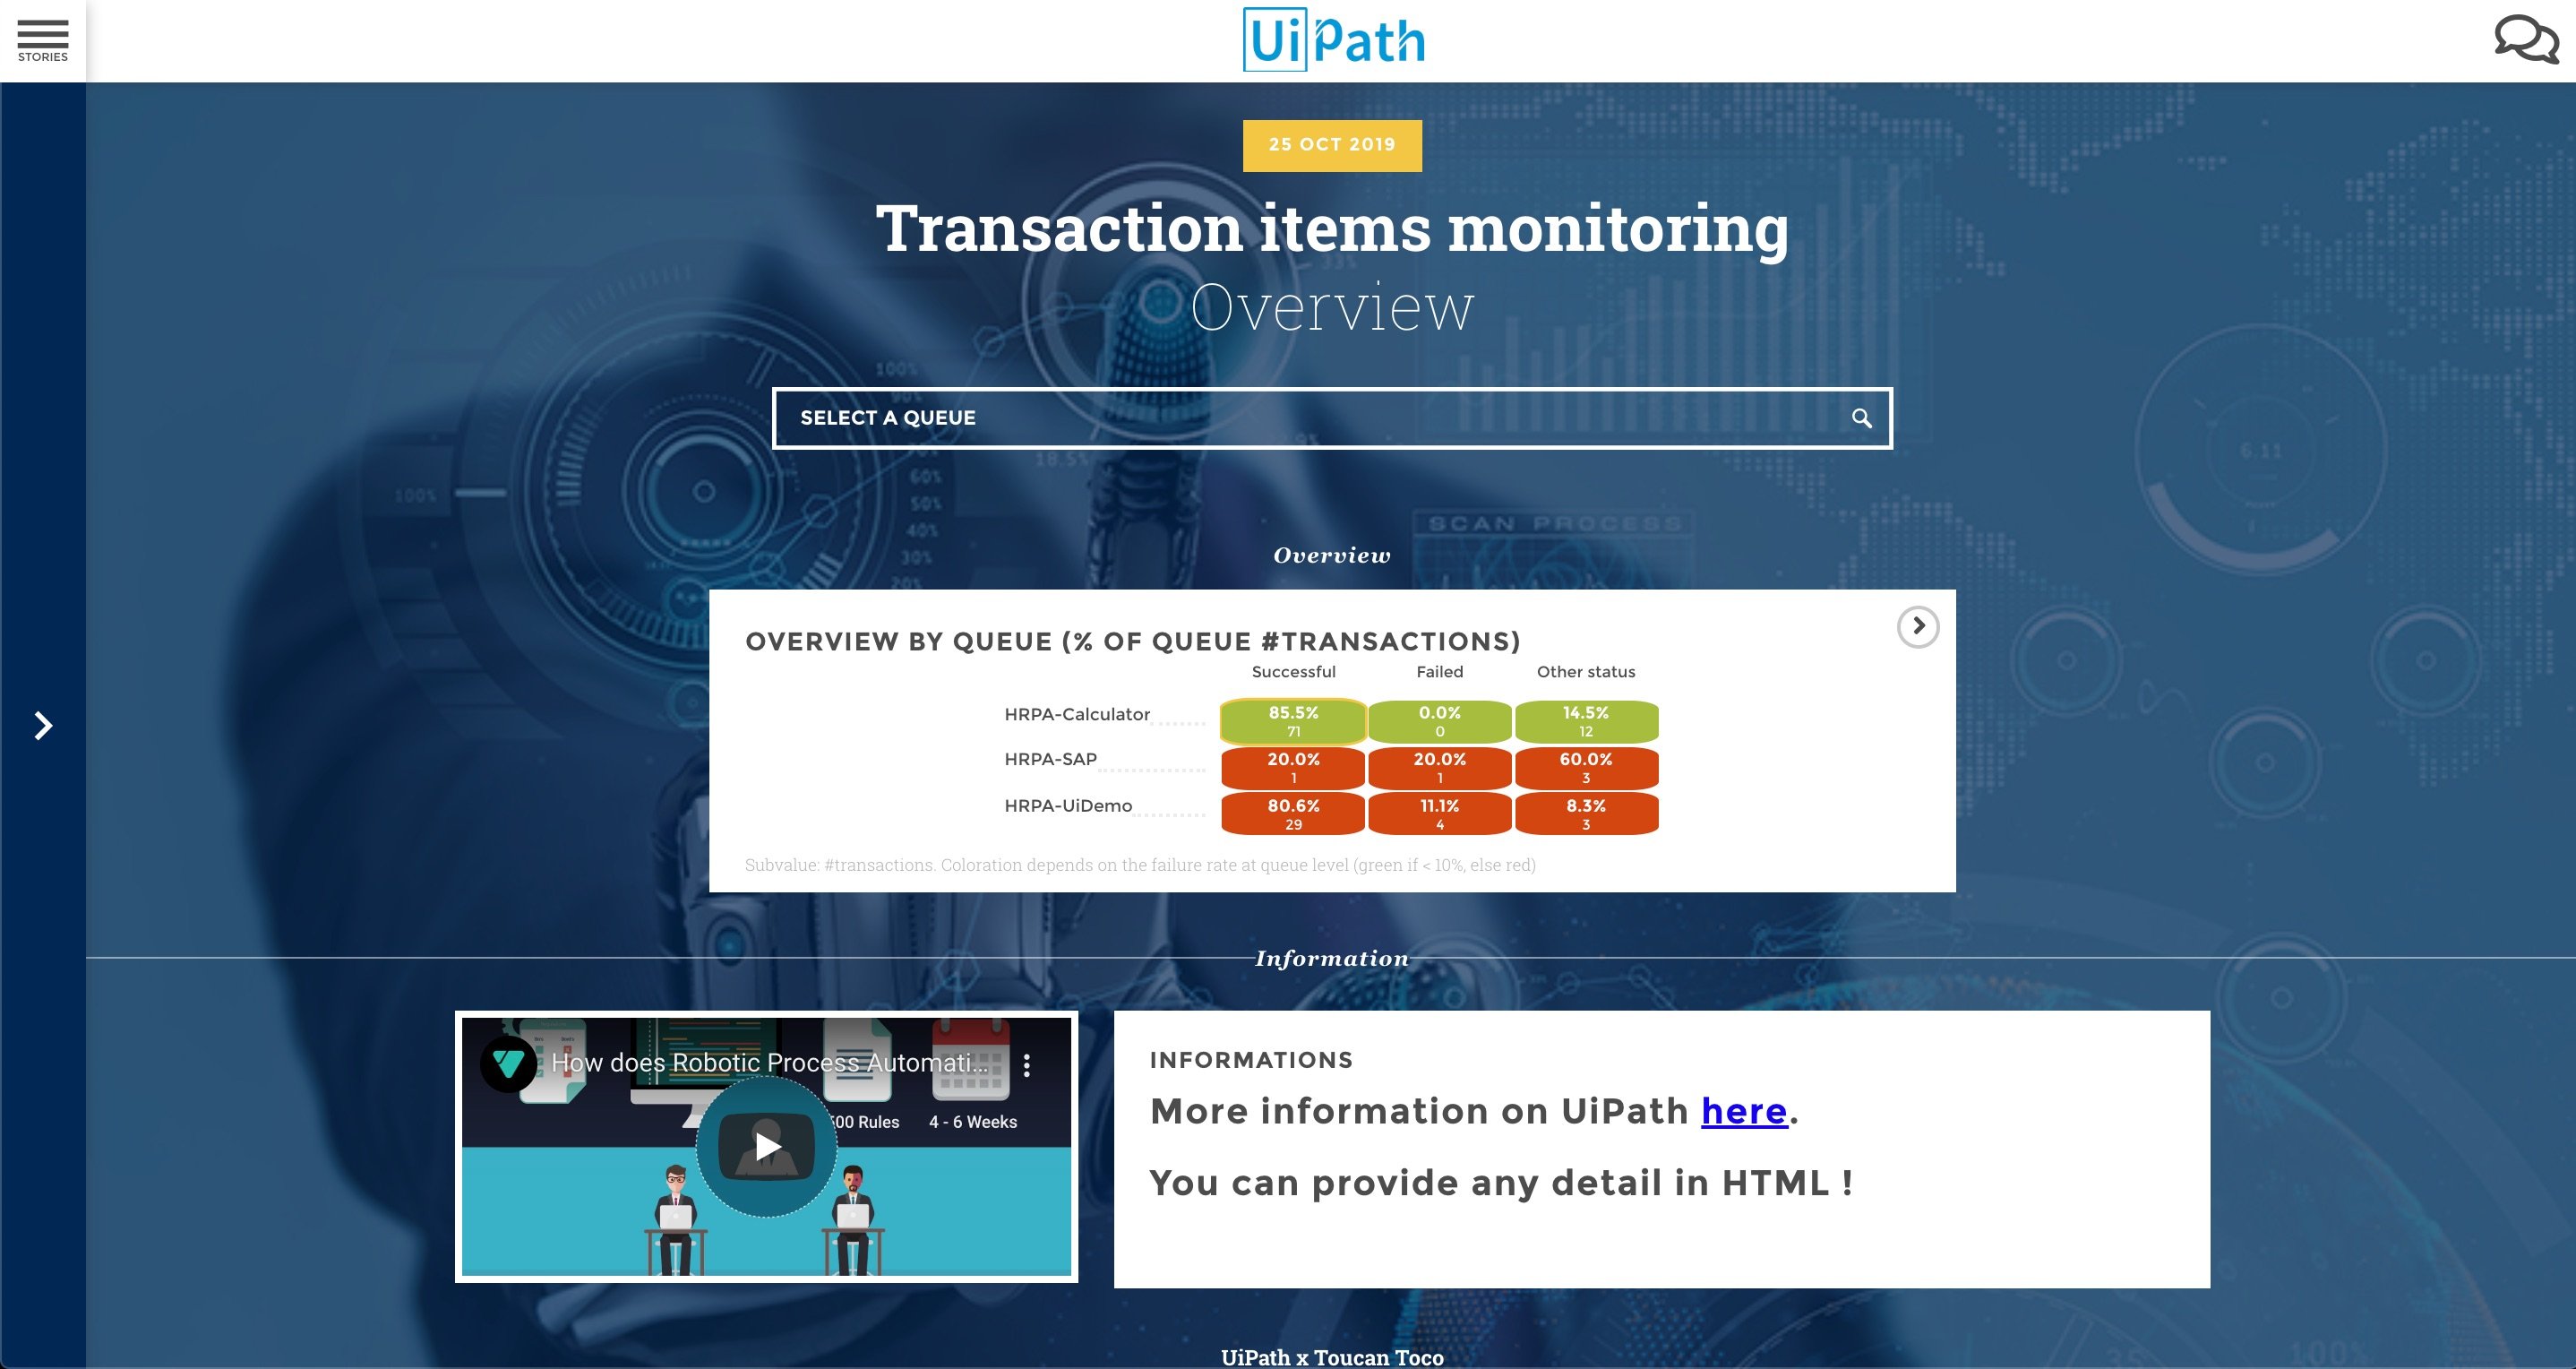
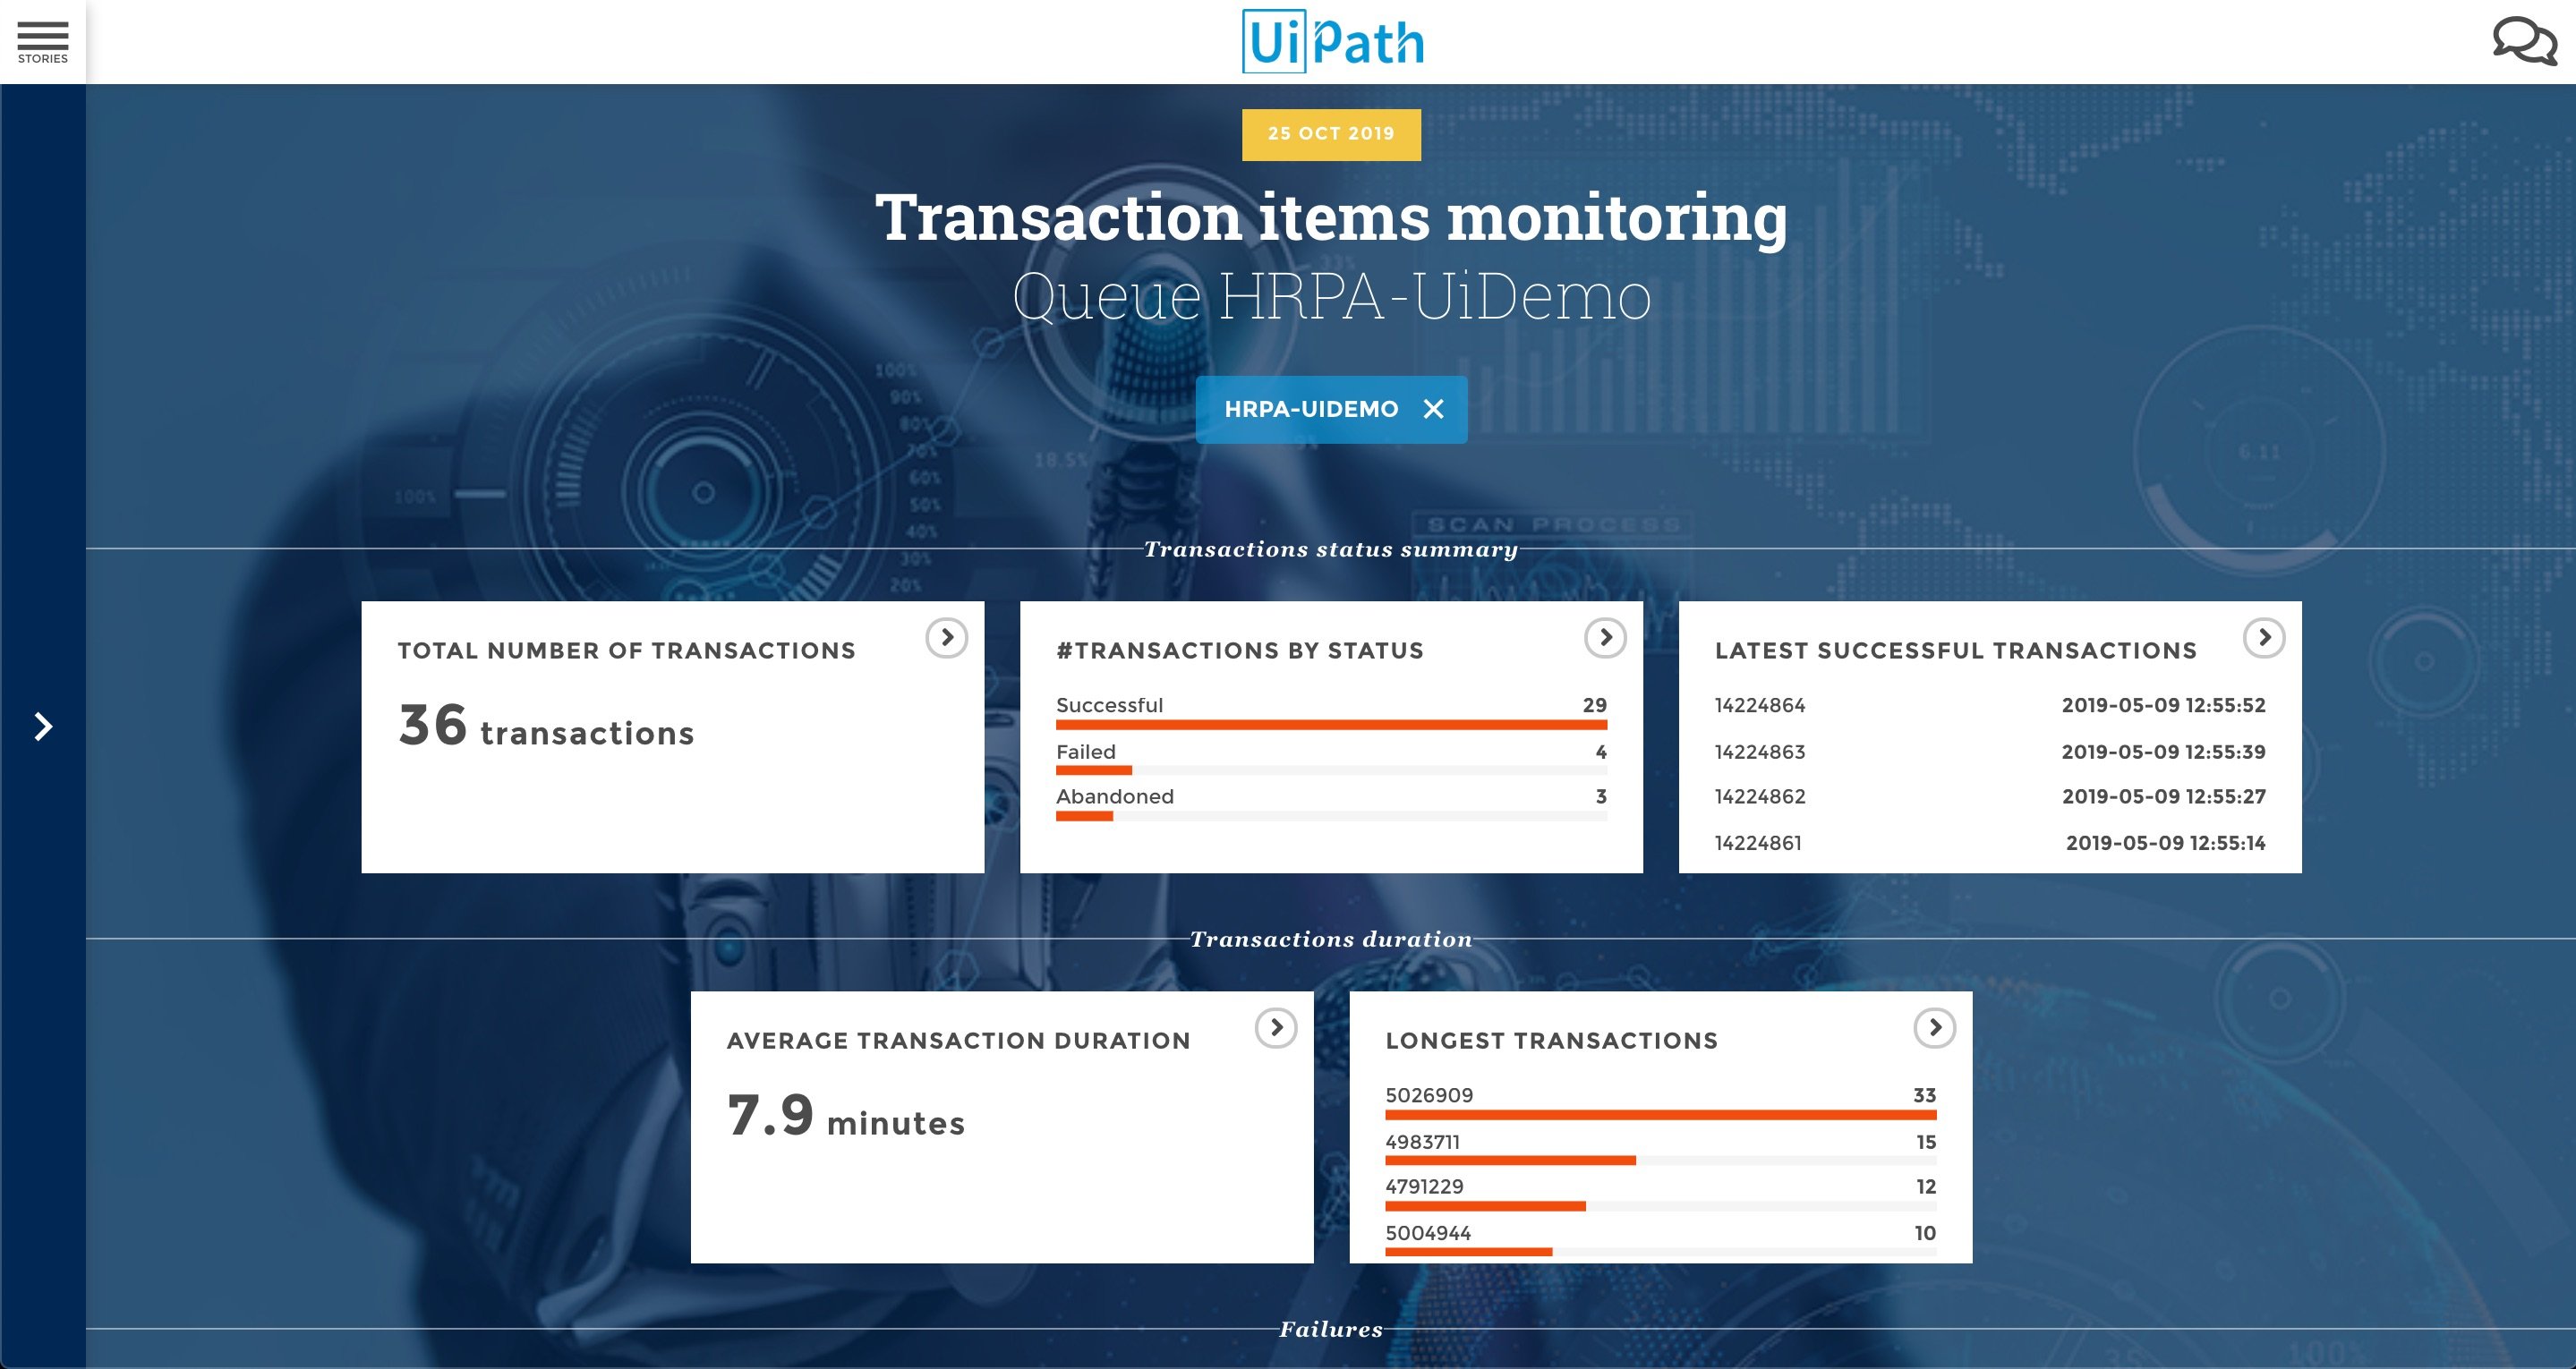
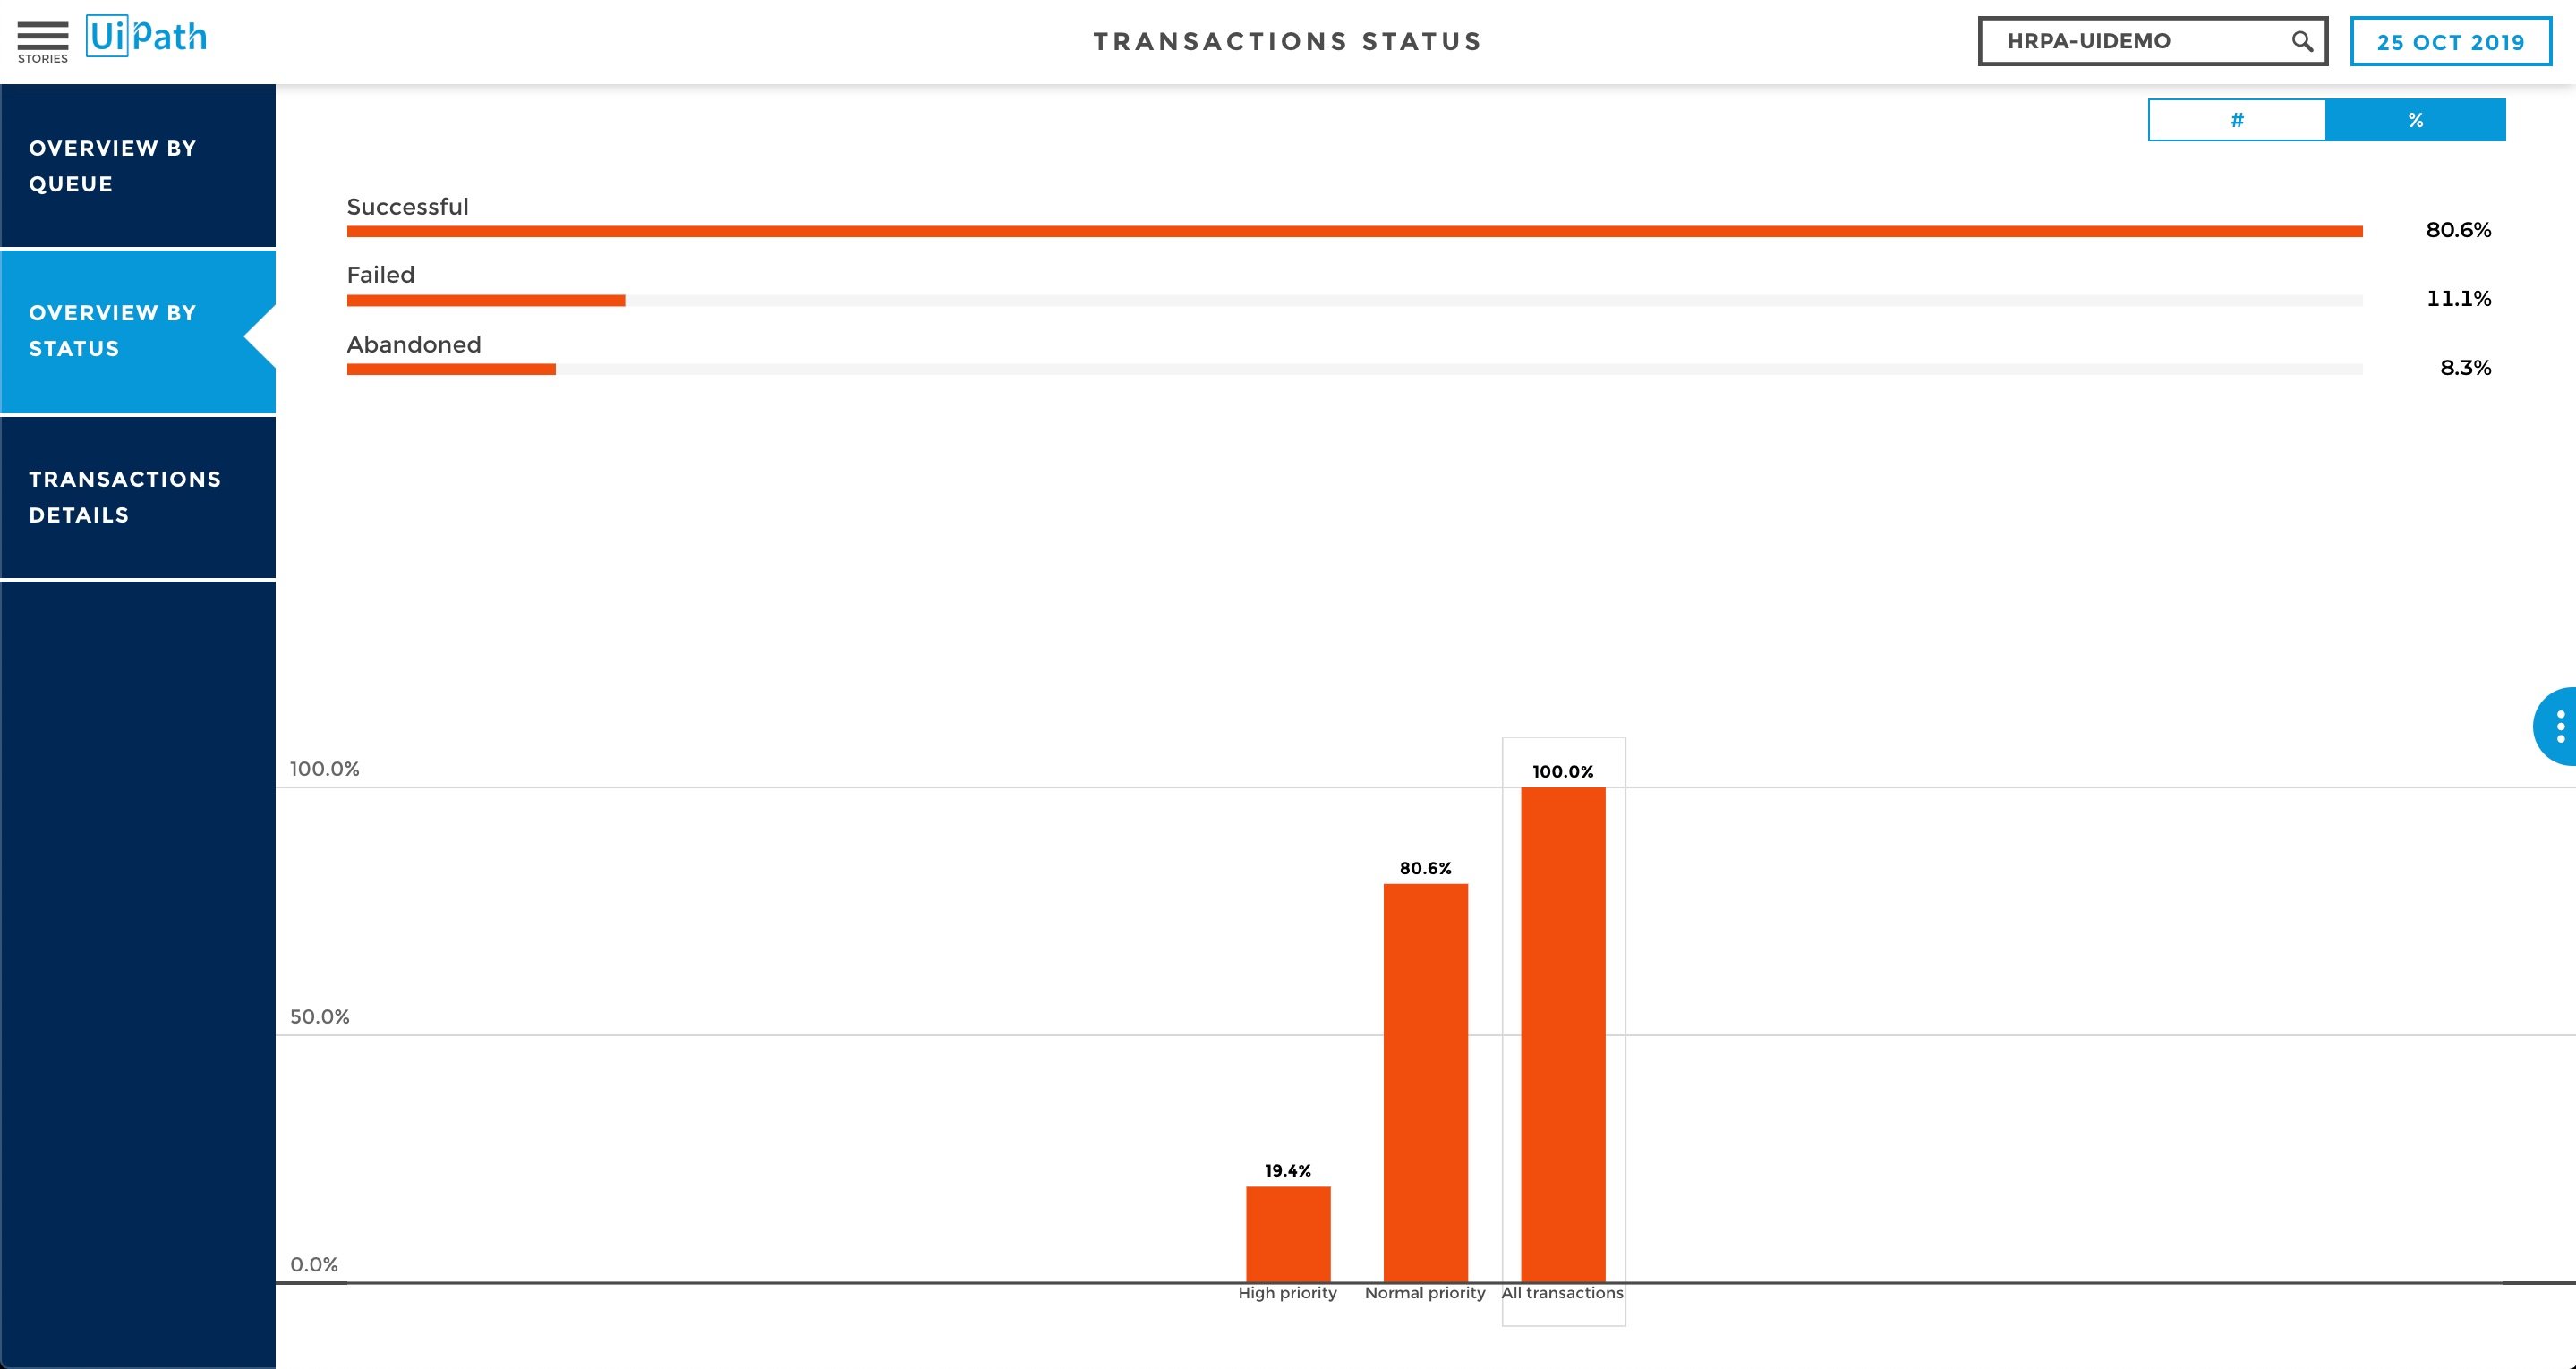
In this public demo, we showcase an application that reports the status of three Orchestrator Queues. You can navigate from a high-level overview to more detailed views about a specific queue.
Features
Features
Intuitive storytelling-based visualization of the digital workforce data Built once, deployed everywhere: responsive design that adapts to desktop, mobile, tablet, data wall, executive summary in PDF, embed on your website ! SaaS and OnPrem deployment Editorialize and contextualize information: comments, glossary, recommandations... Made for collaboration: Annotate & Share, Chat, Export, Presention Mode... Made for action: custom alerts, notifications, share... Ability to set-up custom alerts based on your data Ability to customize your users experience based on their profile: everyone gets access precisely to the content and data that he needs (and has the right to access)
Additional Information
Additional Information
Dependencies
Access to your Orchestrator APIs
Technical
Updated
February 19, 2020
Works with
Orchestrator data visualization and monitoring Mobile-friendly: runs on desktop, tablets, smartphone Also runs on other media: data wall, embed on your website
Tags
Support
UiPath Community Support