Create your first automation in just a few minutes.Try Studio Web →
Tableau Jobs and Queues Dashboard for Orchestrator
by YouTube
4
Tool
541
Summary
Summary
Interactive Tableau dashboards on the topic of jobs and queues processes, using data from the Orchestrator SQL Server database
Overview
Overview
The package includes 2 Tableau Dashboards, one for jobs and two for queues, each of which contains multiple views:
Queues:
- Queues Overview: executive view of the transactions performed during the selected time frame, by final status, for the whole period and over time
- Active Queues: a summary of the queue items currently in process and pending (in queue), broken down by queue name, SLA status and priority
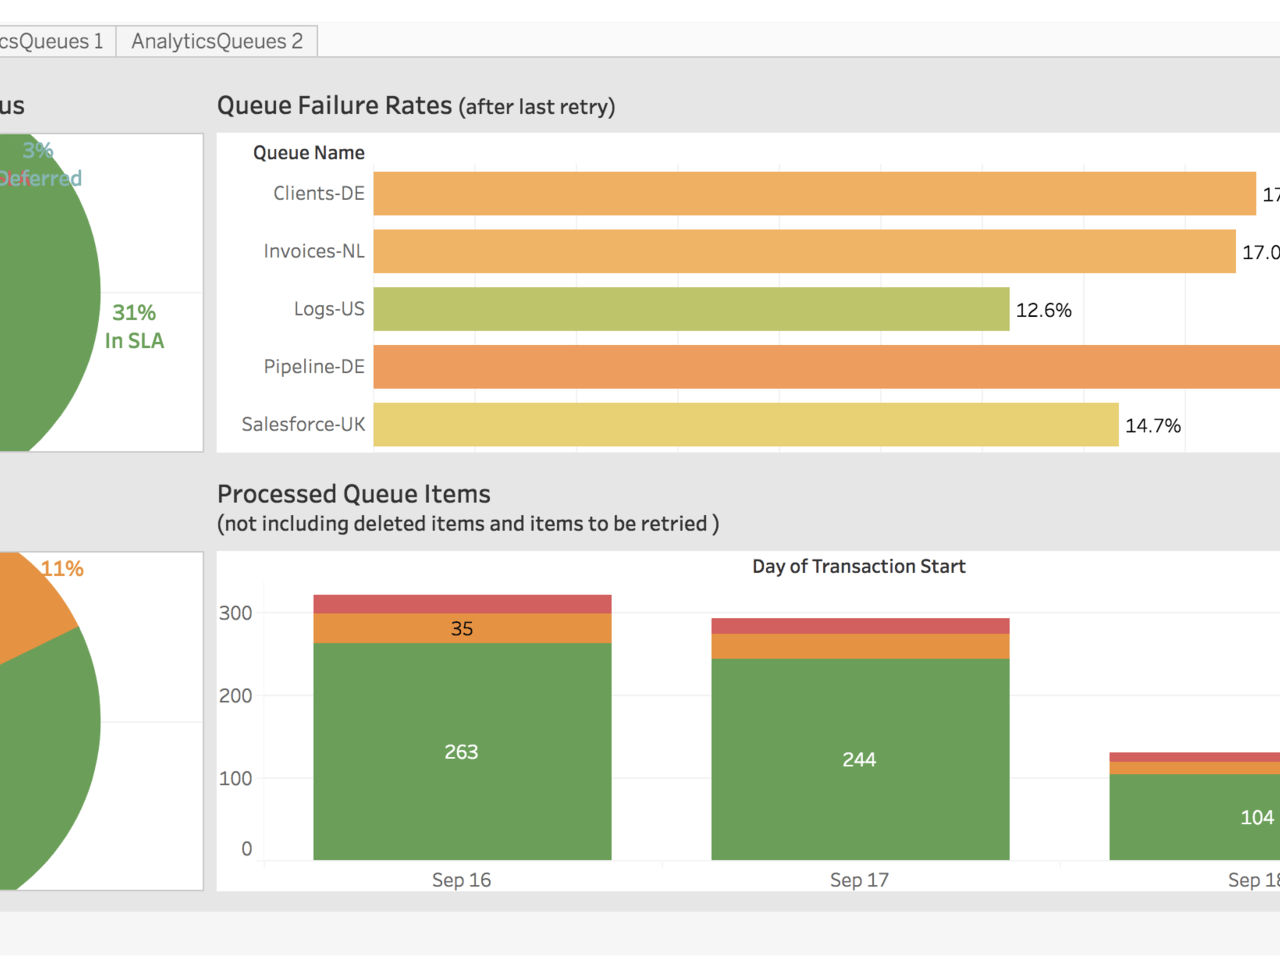
- Queues Analytics 1&2 identifies key metrics for the transactions executed during the chosen time frame, centered around final status, SLA status, duration processing and time spent waiting in queue
Jobs:
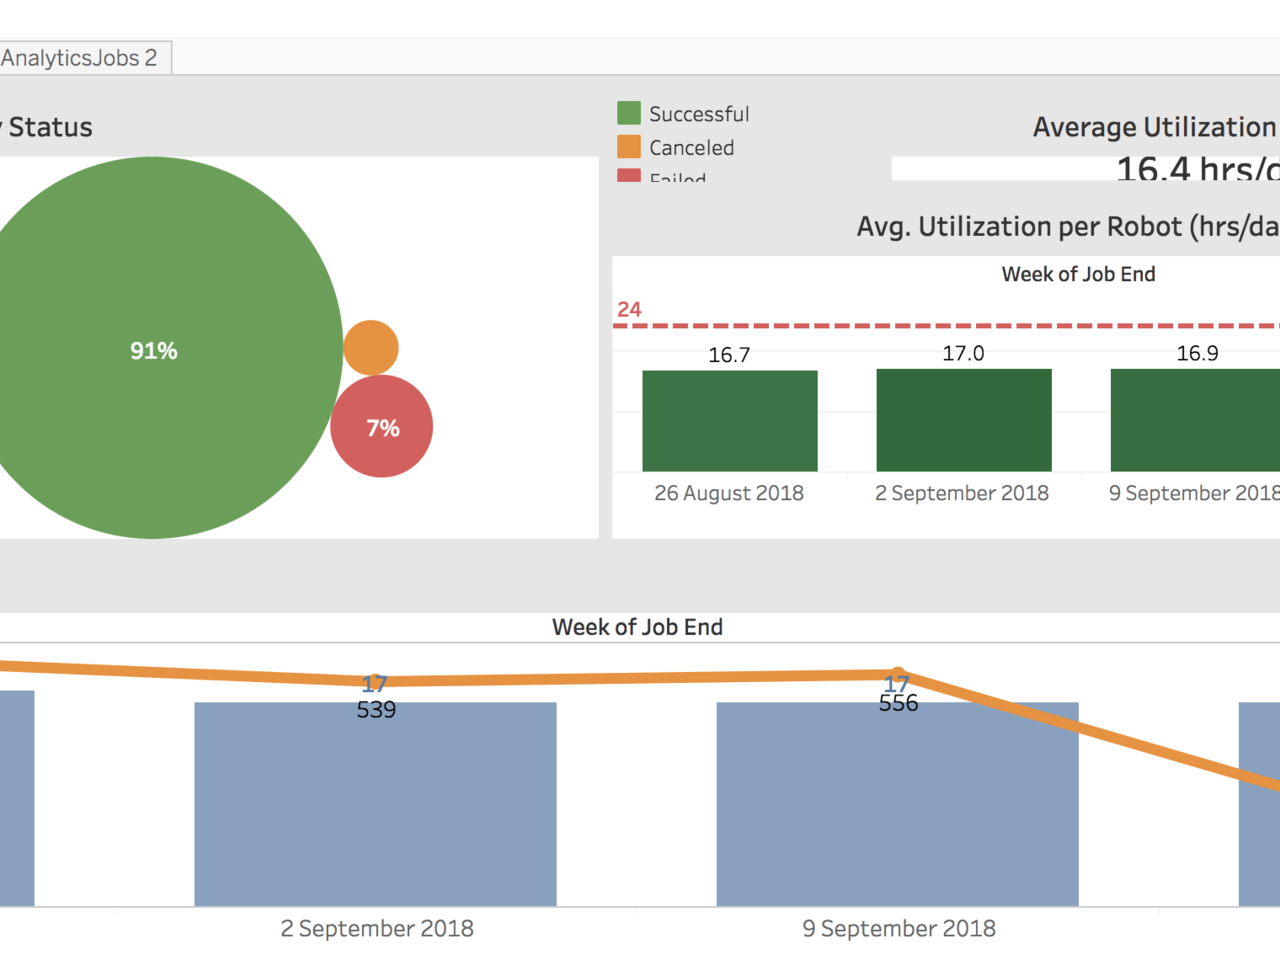
- Jobs Overview: executive view of the jobs performed during the selected time frame, by final status, for the whole period and over time. Also provides the robot utilization in hours worked / robot / day
- Active Jobs: a summary of the jobs currently in process and pending. Currently running jobs are listed, and jobs that run for much longer than expected are flagged.
- Analytics Jobs 1&2 identifies key metrics for the jobs executed during the chosen time frame, centered around final status, duration, duration in pending and volumes (number of times) processed
Features
Features
The Queues Dashboard: Provides an overview of the queue activity in the selected time frame (transaction duration, success rate, exception types) as well as over time. Allows the users to identify queues that need more resources, queues for which the error rates are high - which is an indicator of a need to change processes that consume items for that queue. The Jobs Dashboard: Provides an overview of the job activity in the selected time frame (job duration, success rate, errors) as well as over time. Allows the users to identify processes for which the error rates are high, evaluate the robot utilization numbers and other jobs-related KPIs.
Additional Information
Additional Information
Dependencies
Tableau Desktop (ideally 2018.2 and up, at least 10.5) Orchestrator 2017.1 and up Orchestrator SQL Server rights (read data rights, rights to create views) Orchestrator SQL Server URL and authentication information The Tableau environment must be able to access the SQL Server environment
Technical
Version
1.1Updated
February 18, 2020Works with
2017.1
Certification
Silver Certified
Application
Support
UiPath Community Support
Resources

